Dissertation & Thesis Consulting
HELP for your Research Project from the Proposal to the Final Defense!
Introduction
You need to start writing your Dissertation or Thesis; you know this.
Still, knowing and doing are two very different states, and I understand that getting your dissertation’s Introduction chapter going can be the most challenging aspect of the entire writing process.
And it’s not just you; writers as a whole have struggled with this very problem for the longest of times, namely:
How do I begin? As such, I know exactly how to get your Introduction going such that I put you on the right track toward the ultimate goal: your Ph.D.
Generally, introductions serve as an easy way for the unfamiliar to take on an air of familiarity. In fact, the same can be said about getting your dissertation started. In this case, the Introduction to your dissertation aims to firmly ground an unfamiliar reader in your research topic, developing enough interest along the way such that your audience actually wants to read the rest. In order to facilitate this familiarizing effect, this section of your dissertation begins with setting up the problem, as well as the general topic you aim to explore. Once done, you then dive deeper into the background of the study, identifying the exact importance of the research problem along the way, the latter of which you must communicate in an attention-grabbing manner. Having accomplished this, you can begin making additional connections.
Now, with the Introduction’s framework coming together, we must incorporate the “Statement of the Problem” wherein you begin drilling into the specific issue you will investigate. At this point in particular, you can speak to the general population you will study—reiterating the general problem and the need for the study—before laying out the preliminary research method and design. The “Purpose of the Study” follows, which comprises a few sentences that summarize the motivating rationale behind the study. These sentences should include information about the research method, the research variables involved (i.e., independent, dependent, and relationship comparisons), the setting of the research, the population involved, and the audience about which the problem is of utmost importance. By now, you are creating something quite enticing for your readers and committee to set themselves upon.
The “Significance of the Study” to these same readers. Importantly, this section contextualizes your specific research problem—which strictly applies to the research community and experts in the field—by speaking more broadly to the general problem that affects the community at large. More specifically, this section speaks to how your research aims to add to existing knowledge surrounding the subject, while simultaneously identifying who will benefit from your completing this research. In short, this section contains specific information about the intended impact of the research you aim to conduct.
Following this section, the “Research Design” piece translates the statement of the problem into specific research questions. These questions must be manageable and specific, and most studies include three to five research questions. Notably, your research questions may include sub-questions to answer specific components of a larger question. Regardless, these questions direct the research methods you will employ. For instance, if the research is quantitative, you should define and specify hypotheses. As a reminder, each quantitative research question must have a corresponding hypothesis or hypothesis set (i.e., a null and alternative version of the hypothesis). This applies not only to every quantitative research question, but additionally to each sub-question.
Logically, your research and research questions cannot simply exist in a vacuum. As such, the next section of your Introduction, i.e., the “Nature of the Study” section, serves to connect your research to more than just itself. Particularly, this section must identify the Theoretical / Conceptual Frameworkthat then connects your research study to other research by providing a perspective for interpretation and comparison. You can also juxtapose this section with your “Definition of Terms”, which includes all constructs and variables investigated in the study, including the characteristics of the sample and operationalized terms.
Lastly, your “Assumptions, Limitations, and Delimitations” section starts by identifying any condition that gets taken for granted in research. To clarify, this typically comprises anything most people would agree upon as true without requiring tedious proofs to prove their truth, i.e., your assumptions. In actuality, these assumptions are categorized as: (1) general methodical assumptions; (2) theoretical assumptions; (3) topic-specific assumptions; and (4) methodology- or instrument-specific assumptions. Additionally in this section, limitations refer to aspects of the research project that you cannot control, and pertain to flaws in the research design that can lead to poor conclusions. (This can happen since limitations necessarily refer to inaccuracies that create misleading data.) Alternatively, delimitations refer to variables that you can control, or limit, necessarily establishing boundaries for the specific research project. Generally, delimitations represent areas intentionally left unexplored and serve to assist in future replication of the study. Once you wrap up this last section, you’ll be well-positioned—both in your own eyes and in the eyes of your committee—to tackle the rest of the dissertation.
Literature Review
A review of the methodological literature is relevant to your study. This section must include a review of the methodological choices you settled upon for your study. In fact, be certain you incorporate information about your research design, sample size, instruments, and data analysis. In doing so, you will provide a basis for justifying all of these factors for your study.
Creating a synthesis of research findings that connects your Literature Review to the specific research problem, and follow this piece with a critique of the previous research. In the former, you can discuss the larger themes reviewed, while also touching upon the strengths and weaknesses of each study. Essentially, your synthesis of research findings must aim to provide a summary of the logic behind your study, including the theoretical framework, ideas, and constructs. Follow this section up by providing a critique of the previous research you’ve investigated. Here, you should aim to provide a critical analysis of the research reviewed, including an assessment of specific factors, like the quality of the research reviewed and any accompanying strengths or weaknesses in the various methodologies. Additionally, this component connects these factors specifically to your research direction and argument. By doing so, this section addresses opposing views and controversies, helping construct a strong case for your research study.
Research Question and Hypotheses Development
Imagine you want to examine whether a given social environment influences people’s personalities. This idea presents an interesting problem because both social environment and an individual’s personality represent constructs that researchers can easily measure by investigating any number of distinct components. For instance, is the social environment driven by the country one lives in? Perhaps it’s the generation in which one grew up? Another component that contributes to the definition of social environment as a construct, and the one we will use in this example, is the birth order within a family. Similarly, researchers can measure personalities in a multitude of ways using one of many approved tests. Of course, in addition to identifying the variables that define a construct, how your variables of interest relate to each other should be explained, typically by predicting outcomes or showing differences between groups. For example, a research question and the relevant hypotheses using the previously identified variables and constructs could be:
Research question – Are there differences in extroversion, as measured by introversion-extroversion scores, by birth order (i.e., first born vs. all others) such that first-born children have significantly higher extroversion scores than all other birth-order children?
Ho – There are no differences in extroversion, as measured by introversion-extroversion scores, by birth order (i.e., first born vs. all others) such that first-born children’s extroversion scores do not differ significantly from all other birth-order children.
Ha – There are differences in extroversion, as measured by introversion-extroversion scores, by birth order (i.e., first born vs. all others) such that first-born children have significantly higher extroversion scores than all other birth-order children.
Qualitative Research Question Example
Qualitative research in the social sciences usually takes the form of phenomenological, grounded theory, or case study research. These methods focus more on the in-depth experiences of participants rather than quantifiable measures. Using the constructs in the example above, perhaps the researcher would ask participants what it was like growing up as the first-born child or not, whether they consider themselves introverted or extraverted, and what role their birth order may have played in developing this trait. An example of a qualitative research question is as follows (typically qualitative research only has research questions and does not create formal hypotheses):
Research question – What is the lived experience of an extravert and the role that being first born may have played in that trait?
Considering some dissertations will require several research questions, a great place to start the process begins with selecting a topic and starting to articulate the variables and constructs because these inputs will form the basis behind your research questions. As always, if you would like our help forming research questions or hypotheses, feel free to call us and we’d be more than
IRB/URR Help
I.Your IRB will want a simple explanation of the purpose of your study. While completing the Introduction and Literature Review chapters of your dissertation certainly positions you as an expert in your field, your IRB committee has quite possibly never heard of your topic. As such, it is important to provide a brief description of the state of the field, as well as to identify where the gap in the literature exists and how your study will help fix this issue. Perhaps more importantly, you should also identify why your research is important to the wider population. Since your IRB committee members may be from an entirely different field than you, the most important thing to remember is to be concise and accessible. Your description of the study purpose should be straightforward and should be written in layman’s terms to ensure that your readers can readily understand why they should approve your study.
how you intend to conduct the research
II.Once you have explained why your research is important, it’s time to move onto detailing how you plan to perform your study. This aspect of your proposal should cover all of the specifics around what you will do to prepare for, and actually conduct, your study. As such, this portion of the proposal should begin by informing the review committee of the basic details of the study, including the setting and the personnel who will be conducting research activities. Specifically, you should provide a complete list of any individuals who will be assisting with data collection or interacting with participants. Additionally, it is important to note all locations where data collection will take place, particularly if this will occur off of your campus. This section must also cover the specific experimental protocol that all participants will take part in during the study, which many consider the most important part of this section; therefore, handle this part with great care. Importantly, a proper protocol should describe all details of the participant’s experience, from the moment they are recruited to when they walk out the door. This will include a description of all study activities and questionnaires or surveys (which should also be attached to your IRB application) that the participant will complete, as well as the methods you will use for obtaining consent and debriefing the participants. In short, it is vital that you provide a clear description of this process, as the details of the study protocol can often be a sticking point in the IRB review process.
who will take part in your study
III. You will need to include information about who will take part in your study. One of the primary goals of the IRB is to ensure the safety of research participants, so providing details on how you plan to recruit and treat these individuals is a critical part of any IRB application. To fulfill this requirement, you will need to identify the population of interest for the given study. In doing so, it is important to note what factors will lead to individuals’ inclusion in, or exclusion from, the study and how you will screen potential participants to ensure that they are eligible to take part in research activities. You will also need to specify whether individuals from at-risk populations will be allowed to participate. At-risk populations include individuals who may not be able to make informed decisions for themselves (e.g., individuals younger than 18 years of age or those with mental handicaps) or those populations that may be taken advantage of due to their circumstances (e.g., prisoners or economically disadvantaged individuals).
After identifying who will take part in the study, you will need to provide information regarding how participant rights will be upheld. One of the key components of this is the inclusion of an informed consent form which you must provide to participants prior to their inclusion in the study. This document should inform participants that they have no obligation to take part in the study, and that they can withdraw at any time without penalty. Finally, you will need to include information regarding the risks and benefits of participation in your study. This will include any physical, emotional, or social risks that the participant may encounter, no matter how unlikely. Additionally, you should note what measures you have taken to prevent any negative outcomes for your participants. Furthermore, you will also need to disclose any benefits or payment the participant may receive to ensure that this value is not so high that it can be seen as coercive. By discussing all of these aspects of who will participate in your study, you allow the IRB committee to feel certain that you have taken all of the necessary steps to ensure the safety of your research participants.
how you will manage experimental data once you have collected it
IV.Following these components, you will need to prove to your IRB that you have adequately thought through the aspects around what you will do with your data once you’ve collected it. Essentially, your IRB knows that the goal of any experiment is to acquire data; they simply need the details around how you will handle data management and participant confidentiality. In discussing your plans for data management, you should note specifically how you will store any study materials. This often entails noting that data will be stored digitally on a computer, but you should also specify security measures that will be put in place to protect the data. For example, if you plan on using a password-protected computer, which you will store in a locked office, this is the place to note that. It is also important to state how long you intend to keep any study materials. Many institutions have set guidelines for how long data should be kept after the conclusion of the study, so make sure to check with your school to find what they recommend. This component of the IRB application should also contain details of how you will protect your participants’ confidentiality. In doing so, you will need to specify whether data will be anonymous, de-identified, or if it will contain identifying markers, and how you will ensure participant confidentiality in light of this information.
By addressing these four aspects of your IRB application, you should be well prepared to address any concerns that might arise during the IRB review of your study. However, we understand that gaining IRB approval is a complex and difficult process, and that you may still have questions.
Research Design and Methods
Database Management and Development
I am an expert in SPSS software and statistical operations. If you are a graduate student or researcher, I can assist you in the following areas:
- Understanding the capabilities of SPSS software
- Cleaning, coding and data entry in SPSS
- Choosing the correct statistical test to run
- Interpreting SPSS output
- Statistical analysis of SPSS data output
SPSS software is used to perform quantitative analysis and is used as a complete statistical package that is based on a point and click interface. This software has been widely used by researchers to perform quantitative analysis since its development in the 1960s by Norman H. Nie, in collaboration with C. Hadlai Hull and Dale Bent.
SPSS software can read and write data from other statistical packages, databases, and spreadsheets. When entering data into the software, one has to click on “variable view.” The variable view enables the user to customize it by data type and consists of the following headings: Name, Type, Width, Decimals, Label, Values, Missing, Columns, Align, and Measures. These headings enable the user to characterize the data.
SPSS is most often used in social science fields such as psychology, where statistical techniques are involved at a large scale. In the field of psychology, techniques such as crosstabulation,t-test, chi square test, etc., are available in the “analyze” menu of the software.
There is also an option in the software called “split file,” which is given in the “data” menu. This option is very useful for researchers who are performing comparative studies. Suppose researchers want to know the literacy rate of three regions. In this case, the split file option will help them get the result of three regions separately so that they can interpret and compare the literacy rate of the three regions.
SPSS software has a technique called missing value analysis, and this technique helps in making better decisions about the data. This technique enables the user to fill in the missing blanks in order to create better models to estimate the data. The analysis provides the user with procedures for data management and preparation.
SPSS involves some sophisticated inferential and multivariate statistical procedures such as factor analysis, discriminant analysis, ANOVA, etc. SPSS, as the name suggests, is software for performing statistical procedures in the social sciences field. The major limitation of SPSS is that it cannot be used to analyze a very large data set. A researcher often gets a large data set in the field of medicine and nursing, so in those fields, the researcher generally uses SAS instead of SPSS to analyze the clinical data.
Statistical Analysis and Results Section
The cleaning of data is the removing of univariate and multivariate outliers, dealing with missing data, and assessing for normality.
Univariate outliers
Univariate outlier refers to an observation with a standard deviation of greater than ±3.29 from the mean. This is easily accomplished by standardizing the scores of a variable (i.e., the variable’s scores have a mean of zero and a standard deviation of 1), and looking for an observation greater than ±3.29.
Multivariate outliers
Multivariate outliers refer to outliers on a combination of two or more variables. To assess for multivariate outliers, you can conduct a regression with the observation ID number as the dependent variable, the variables being assessed as the predictors, and assess for Mahalanobis' distance. Then examine an observation’s Mahalanobis' distance score relative to the degrees of freedom (i.e., the number of variables will equal the degrees of freedom) for a chi-square value at the p=.001 level.
Missing data
Missing data is the absence of an observation on a variable. There are a few remedies: drop the observation with the missing data, mean substitution, and multiple imputation (using SPSS or EQS).
Normality
Normality refers to the shape of the distribution of scores (e.g., shape of a normal bell curve). To assess for normality, a researcher can examine skewness and kurtosis of a variable, or conduct a 1-sample KS test. The KS test will report whether the distribution of data is significantly different than a normal curve.
Transforming the Data
Many multivariate tests assume normality. When the data is not normally distributed a transformation of the data can be appropriate. Some common transformations are the square root, logarithmic, and inverse.
Analyzing the Data
The selection of the analysis is based on two things: the way the hypothesis is stated in statistical language and the level of measurement of the variable.
The Hypothesis
The way the researcher states the hypothesis makes a difference in the data analysis. Here are three null hypothesis examples: (1) Variable A does not relate to Variable B, (2) Variable A does not predict to Variable B, (3) There are no differences on Variable A by Variable B. (1) tends to be stated in correlation or chi-square language, (2) in regression language, and (3) in ANOVA or perhaps Mann-Whitney language. How is one to choose the precise data analysis? It depends on the level of measurement of each of the variables A and B.
Level of Measurement of the Variables to Select the Correct Data Analysis
In the hypotheses above, the level of measurement of the variables is a key factor in selecting the correct data analysis. In example (1) if the variables are both categorical the correct analysis would be a chi-square test, while if both variables are interval-level, a Pearson correlation would be the correct analysis. In example (2), regression is the appropriate test (i.e., examining the influence of a variable on another variable), linear regression is the correct analysis if the dependent variable is interval-level, logistic regression if the dependent variable is dichotomous, and multinominal logistic regression if the variable has three or more categories. In example (3) if the dependent variable is interval an ANOVA may be appropriate while an ordinal dependent variable a Mann-Whitney may be the analysis.
Putting the Data Analysis All Together
In the data analysis plan, data cleaning and transformation should be addressed, then discuss the data analysis of the data. Be sure to state the hypotheses the way you want—to examine relationships, to predict, or to examine differences on a variable by another variable.
Statistics Solutions can assist with the development of your quantitative or qualitative data analysis plan. We offer the following services:
Data Analysis Plan
- Edit your research questions and null/alternative hypotheses
- Edit data analysis plan; specify specific statistics to address the research questions, the assumptions of the statistics, and justify why they are the appropriate statistics; provide references
- Justify your sample size/power analysis, provide references
- Explain your data analysis plan to you so you are comfortable and confident
Sample Size / Power Analysis
Every study needs data, the question is how much data are needed. The sample size determination using a power analysis is the process of figuring that question out and will be of particular interest to both your committee for Proposal and IRB approval. Details below briefly examine how a power analysis calculates sample size, before going into how to use free resources to determine your study’s sample size in just a few minutes.
Power Analysis.
For a given statistical test, the sample size is calculated from statistical power, effect size, and significance level. That is, each of these four components of your study—namely, sample size, statistical power, effect size, and significance level—are a function of the other three. Specifically, the effect size of your study tells you the strength or importance of a particular relationship. The power, typically .80, is the probability of not making a type II error, which differs from beta, or the probability of making a type II error.
Discussion Section Interpretation
Next, you will need to provide a summary of your study and what it encompassed, including your findings and conclusions. Additionally, you will likely want to organize this information by research question and its related hypotheses. In fact, this organizing structure works out nicely: After you discuss each research question and its related hypotheses, you can smoothly integrate your conclusions (i.e., follow each discussion of a research question and its related hypotheses with the relevant findings and conclusions). Importantly, you must take care here—your committee will want you to use language that makes this last part clear such that no ambiguity remains concerning what comprises your conclusions.
Furthermore, be sure to dedicate sections to discussing your results, always as they relate to the literature, as well as a section on the limitations of your results. Thoroughly addressing these sections solidifies your position in your readers’ eyes as the expert. You will then want to use this positioning to lay out all of the implications you recognize your results have for actual practice, while also providing insight into any recommendations you have for additional research.
Note that in your implications section, you will want to make a broader connection to the social significance of your study, especially as it relates to professional practice or applied settings. Alternatively, in the recommendations section, you should consider what your research necessarily implies, and what your data support investigating further. Of course, a natural place to delve into here starts with your study’s delimitations—since these represent places you did not go in your investigation—as well as areas related to the study that the current research data did not support. Ideally, you will provide readers with a proposed methodology and design that you feel fits each recommendation. In short, this section of your Discussion Chapter provides you with a place to help guide future efforts that emanate from what you are now polishing.
Finally, once you have all of these pieces assembled, you will need to elegantly compose a conclusion section to your Discussion Chapter that includes an overview of the chapter and your research findings. Typically, a final description of the findings related to the research questions, along with a suggestion for how the study may further the understanding of the problem, also gets included. Essentially, you should treat your conclusion section as your final opportunity to share a concise overview of your findings and your conclusions.
To review, your Discussion Chapter should be treated with care, and not simply because you, your mentor, and your committee want you to; it, in fact, may be the only opportunity you get to impress upon readers just how integral your study has been to advancing the knowledge in your field. In other words, this chapter may very well be the only one people read post-publication. And while you certainly want to be thorough, you also want to aim for a well-informed succinctness that simultaneously avoids watering down the power of what you have to offer.
Statistics Tutoring
Individual Tutoring
Individual tutoring provides you with an introduction to the basic methods of collecting, organizing, and analyzing psychological data. YOU will learn a variety of descriptive and inferential statistical techniques. The inferential techniques include an emphasis on statistical inference (e.g., t tests, F tests, and selected non-parametric statistics). The basic statistical concepts and skills necessary for the laboratory research, survey work and to provide adequate quantitative background for understanding psychological literature.
Statistical Analysis
- ANOVA (Analysis of Variance)
- Factorial ANOVA
- Repeated Measures ANOVA
- ANCOVA (Analysis of Covariance)
- Factorial ANCOVA
- Repeated Measures ANCOVA
- Binary Logistic Regression
- Bivariate Correlation
- Chi-Square Goodness-of-Fit
- Chi-Square Test of Independence
- Dependent Samples t-test
- Discriminate Analysis
- Exploratory Factor Analysis
- Hierarchical Multiple Regression
- Independent Samples t-test
- Linear Regression
- MANOVA (Multivariate Analysis of Variance)
- Factorial MANOVA
- Repeated Measures MANOVA
- MANCOVA (Multivariate Analysis of Covariance)
- Factorial MANCOVA
- Repeated Measures MANCOVA
- Mediation Analysis
- Multinomial Logistic Regression
- Multiple Regression
- Multivariate Regression
- Phi Correlation
- Point-Biserial Correlation
- Reliability Analysis
- Spearman Correlation
- Stepdown Regression
- Stepwise Regression
- Structural Equation Modelling
- Test for Moderation
Premium Statistical Services
COURSES
All Statistics Courses available to be taught to you!
Some examples are:
-
Inferential Statistics
-
Descriptive Statistics
-
Behavioral Sciences Statistics
-
Business Statistics
-
Demand Forecasting
-
Probability
-
Research Design
-
Elementary Statistics
-
Introduction to Statistics
-
Quantum Methods
-
Data Mining
-
Aggregate Planning
-
Multiple and Linear Regression
-
Linear Programming
-
ANOVA Models
-
Sampling Methods
-
Experimental Design
-
Experimental Statistics
Inferential Statistics
Training for Six Sigma Certification
Six Sigma Certification Training for Black, Green, and Yellow Belt Candidates!
I am a Certified Lean Six Sigma Black Belt and can help you prepare for your certification test!
Six Sigma Methodology
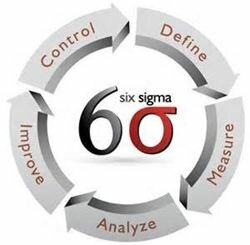
- Define the problem, the voice of the customer, and the project goals, specifically.
- Measure key aspects of the current process and collect relevant data.
- Analyze the data to investigate and verify cause-and-effect relationships. Determine what the relationships are, and attempt to ensure that all factors have been considered. Seek out root cause of the defect under investigation.
- Improve or optimize the current process based upon data analysis using techniques such as design of experiments or mistake proofing, and standard work to create a new, future state process. Set up pilot runs to establish process capability.
- Control the future state process to ensure that any deviations from target are corrected before they result in defects. Implement control systems such as statistical process control production boards, visual workplaces, and continuously monitor the process.
Example topics taught:
Acceptance, and Acceptable quality level (ACL)
- Acceptance has at least two different meanings in Six Sigma terminology, so be careful to understand which one is being referred to. Firstly, acceptance relating to quality is the quality expectation of the customer, internal or external. Acceptable Quality Level (ACL) means the same basically, in more formal Six Sigma-speak, and which will frequently be expressed in terms of percentage defects. Secondly acceptance refers to the buy-in or agreement of people affected by proposed actions and changes, notably stakeholders. While not strictly part of the Six Sigma battery of supporting tools, I can strongly recommend Sharon Drew Morgen's facilitative communications concepts for anyone struggling with stakeholder acceptance (and wholesale organizational change as well for that matter.)
Activity report
- A simple tool which enables teams and team leaders to manage project management tasks, responsibilities and timescales.
Affinity Diagram
- A diagrammatic method of capturing, analyzing and organizing lots of ideas, elements, activities, etc., that together represent or influence an overall category, such as a process or issue. The brainstorming method is central to structuring an affinity diagram, and 'post-it' or sticky notes are commonly used as a way of generating and organizing data. Commonly used in brainstorming solutions during the Improve stage of DMAIC.
Analysis
- Analysis of all sorts of data is a critical component within the Six Sigma model, which involves using various analytical methods to identify and quantify the causes of quality variation and failure in specific processes. Various analysis perspectives are adopted, for example:
- discrete - looking at a particular failure or problem - eg.,using Pareto ('80:20') or pie-charts to show causes by percentage
- continuous - mapping performance variation and types, etc., overtime, using distribution graphs
- process - creating detailed flow-diagrams to understand what's really going on in the process or sub-process
ANOVA, ANCOVA, MANOVA, MANCOVA
- Despite first impressions these are nothing to do with Russion gymnastics or ice-skating moves. ANOVA is an acronym for analysis of variance, a specialized variation calculation method concerned with comparing means and testing hypotheses, best left to engineers and mathematicians. So are the related methods, ANCOVA (analysis of covariance), MANOVA (multiple analysis of variance), and MANCOVA (multiple analysis of covariance). Unless you are an engineer or a mathematician you will almost certainly have better things to do than get to grips with this level of statistical capability. Terms such as these illustrate why we need to work in multi-disciplined teams.
- A sophisticated strategic analysis and improvement methodology developed by Kaplan and Norton which in its own right can sit outside Six Sigma, but which can be included within Six Sigma methods, and in any event might be used or referenced in the context of quality and performance improvement. The 'balanced scorecard' identifies, correlates, 'balances', measures and drives improvement across a wide variety of factors that are deemed responsible for overall organizational effectiveness, and for meeting customer expectations. The tool essentially translates strategy into operational metrics, and according to Motorola (ie., in a Six Sigma context) typically features the perspectives of, vision, current initiatives, business processes, and business results. 'Balanced Scorecard' became a generic 'brand' for business improvement in the 1990's, rather like Six Sigma, although arguably not on such a grand scale.
Black Noise/White Noise
- Technical terms relating to respectively non-random and random causes of variation.
Business Improvement Campaign
- A Motorola Six Sigma buzz-phrase, which represents a leadership initiative to improve the business's 'big Y's'.
Business Process Management
- A common generic expression in its own right, but also a Six Sigma term for the initial strategic element of Six Sigma. Six Sigma's strategic first phase is designed to develop management's commitment to Six Sigma, and also management's active participation in the Six Sigma process (which suggests why a powerful brand name for the initiative, ie., Six Sigma, is helpful..). This amounts to identifying the key processes within the organization that determine effectively meeting customer expectations; then measuring the effectiveness and efficiency of the processes (notably measuring variation in quality and analyzing the causes), and then initiating improvements in the weakest processes, which should logically yield the greatest results and return on effort.
Cause-Effect Diagram
- Also known as the fishbone diagram, this is a generally used tool for mapping and analyzing causal factors towards an end output, so that contributing factors (and weaknesses can be more easily identified). Used especially in Six Sigma as a team brainstorming analysis tool. Called a fishbone diagram because the diagram plots contributing factors along parallel diagonal lines which each join a central horizontal time-line (like the back-bone) which culminates at one end with the main issue or question.
CTQ
- Critical To Quality - An element within a process that has a major influence on the process quality, and typically the quality of a critical process, or it would be unlikely to be receiving Six Sigma attention.
Defect -
A vital and generic Six Sigma term for any failure in meeting customer expectation (internal and external customers) - any failure within the delivery process.
DFSS - Commonly used abbreviation in Six Sigma activities and communications, it means Design For Six Sigma, and describes the method of using tools, training, measurements, and verification so that products and processes are designed at the outset to meet Six Sigma requirements. A more specific version is DMADV: Define, Measure, Analyze, Design, and Verify. Both DFSS and DMAVD are concerned with, and emphasize the importance of, using Six Sigma principles in product/process design, not just for remedial improvements - rather advocating that prevention is better than cure. Thus, if Six Sigma capability is built into new organizational systems and products when they are designed, so performance will be better, and the need for Six Sigma remedial effort will be reduced.
DMAIC/DMAICT -
Central Six Sigma process and acronym to ensure you remember it: Define, Measure,
Analyze Improve, Control, more recently extended to DMAICT by others in the Six Sigma consulting and training communities, to Transfer (transfer best practice and thereby share learning).
DMADV
- An alternative/substitute abbreviation to DFSS (Design For Six Sigma), and like DFSS DMADV is central to Six Sigma initiatives. DMADV more specifically describes a method comprising linked steps;
Define, Measure, Analyze, Design, Verify
-For ensuring that products and processes are designed at the outset to meet Six Sigma requirements.
Frequency Distribution/Frequency Distribution Analysis or Check Sheet
- Frequency distribution and the check sheets and other frequency distribution measurement tools form an essential aspect of Six Sigma data analysis. Identifying frequency of variation in processes is central to Six Sigma, since customers are particularly sensitive to variation, arguably even more than isolated failures. Therefore the sampling and collection of data over many operations and extended time periods, and the use of this data to indicate the frequency (number of times) that a variation occurs rather than the size of isolated failures, is an essential perspective for truly understanding what's happening, and the causes, within any critical delivery process. Frequency distribution analysis is an excellent antidote for any temptation to respond to an isolated failure with a knee-jerk quick fix, such as shooting the messenger or bollocking the workers when something deeper in the process is awry.
Just In Time (JIT)
- Just In Time, commonly abbreviated to JIT, describes operational or production methods based on minimizing stock levels, the aim of which is to reduce capital employed in stock, which also has knock-on benefits to reducing storage space, decreasing dependence on logistics, easier supply chain management, and better overall quality. Just In Time is actually a capability arising from improvements within a business operation, rather than a cause of improvement itself. Introducing Just In Time methods without improving efficiency and reliability necessary to support it is not viable. Since Just In Time methods entail reducing stock levels to absolute minimum or even zero, JIT allows no room for error. Timing and predictability are crucial. JIT requires total commitment to quality and efficiency or the supply chain and related operations break down, the costs and implications of which can easily exceed any savings from JIT stock reductions. The term and methodology were developed by the Japanese during their post-war industrial revival (second half of the 1900s) as a logical progression from 'materials requirements planning' (MRP). The Japanese original terminology is 'kanban', and is important within 'lean production' methodology. The aim of kanban is actually zero inventory. JIT features in highly efficient manufacturing corporations, and has more recently been significantly enabled by computerization, especially to analyze and manage timings rather than stock levels. Noted authors to have covered the subject include Edwards Deming, Taiichi Ohno, and Yasuhiro Monden. The acronyms page contains a more amusing definition of JIT.
Materials Requirements Planning (MRP)
- production quality management methodology focusing on planning stock (materials and components of all sorts) levels and availability according to production schedules.
Pareto Principle, Pareto Diagram, Pareto Analysis
- The Pareto Principle is otherwise and more commonly known as the 80:20 rule. The Pareto Principle was named after its originator Vilfredo Pareto, (1848-1923) an Italian economist and professor of political economics at Lausanne University, who first discovered the 80:20 'rule' of 'predictable imbalance', that (as far as Six Sigma is concerned) provides a basis for focusing on the 20% of activities that generate 80% of results, or the 20% of failures that are responsible for 80% of the waste, etc. Pareto first made his discovery while analyzing wealth distribution among the British, in 1897. The Pareto Principle is also known as The Pareto Law, The Principle Of Least Effort, and The Principle Of Imbalance, which in themselves provide an example of the Pareto Principle in action because despite all the options, hardly anyone ever uses any other name than 'The 80:20 Rule'. More Pareto explanation and examples in use.
Process
-The word process is worth mentioning because it is a fundamental cause of confusion (and not just in Six Sigma, but that's another story). The word process is used heavily in describing how Six Sigma works, and it's also used heavily in referring to the service or production activities(processes) on which the Six Sigma methods (or processes) are directed. You see what I mean... It is both the subject and the object. People easily get confused by terminology at the best of times, so it's worth taking extra care when using words like process which have at least two distinctly different meanings. For example avoid phrases such as "Six Sigma is a process that uses processes to improve processes." It's true, but its a load of bollocks. So, when using the word process, check that people know what process you are actually referring to, and then you will have a fighting chance of not disappearing up your own backside.
Process Mapping
- diagrammatical representation of how processes work, as could be used and developed in team meetings on a flip-chart, or other media, to enable teams to understand processes, participants, and where and how improvements might be made.
Production Planning
- generic term describing the over-arching methodology used in managing the supply process from receipt (or forecast) of customer requirements through to delivery notes and invoicing. Production planning therefore includes:
- interpretation of customer orders/requirements
- works orders
- schedules and computer programs/ implications
- parts, stocks and materials
- machinery, plant, equipment availability and allocation
- people and teams
- quality and other targets - setting and monitoring
- stock and purchasing monitoring and records
- order processing, administration and accounting
- necessary inter-departmental liaison (e.g., sales, export,etc)
Production planning is typically highly modularized and computerized since process reliability is crucial and is systematically repeated, although production planning must also allow for variation in response to sales or other changing demands and product specifications. Production planning is generally a weekly and monthly requirement, as well as incorporating longer-term commitments and considerations. The particular sales environment and predictability of the market and business have major impacts on production planning. Volatile markets and unpredictable sales obviously make production planning more difficult. Costs and budgets, health and safety, environmental, and other indirect considerations or compliances are of course relevant to production, but not directly, and so are not included as integral parts of the process.
Q x A = E
- a natty little formula advanced by Six Sigma writer George Eckes for emphasizing and assessing the need for Six Sigma projects to feature both strong technical quality (Q), andstrong acceptance by the stakeholders of the project team's proposed solutions (A). E represents the excellence of the results, although why it should be E and not R rather defeats me. Whatever, the idea is a sound one, in that A is a multiplier and should along with Q should be assessed in simple terms at the early phase of a Six Sigma project. Eckes suggests scoring each of Q and A out of 10, and that if E equals anything less than 60 then the project is unlikely to succeed, with the implication to return to improving technical quality and stakeholder buy-in.
Six Sigma
- how long have you got?.... at its most basic Six Sigma equates to 3.4 defects per million opportunities; at its most sophisticated (dare one suggest most hyped?..) Six Sigma is an organizational philosophy.
Soft Skills
- skills required for managing people, relationships, acceptance and effective communications. A potential area of vulnerability in many Six Sigma implementations, because of the predominance of Six Sigma team leaders with strong process skills and attention to detail, which can sometimes be at odds with the abilities of intuition, empathy, rapport-building, relationship-building, and other 'soft' people-skills.
- vitally important aspect, this one: stakeholders are not just customers, stakeholders are all the people who are affected by the solutions identified within a Six Sigma project, and all the people with some involvement in implementing the solutions.
Tollgates
- breaks for review between Six Sigma processes within any of the DMAIC stages.
Tree Diagram
- pictorial representation of how a broad aim is broken down into detailed actions, and which belong to named individuals or departments. A mapping technique that promotes creative thinking towards detailed causes and effects and accountabilities. Helps to avoid tendencies for activities and accountabilities to be left too vague.
Six Sigma History
First and simply, Six Sigma is a quality improvement methodology.
Six Sigma has also become a generic 'brand' for a set of concepts that many organizations have used, and continue to use, to improve quality, and to provide quality and performance improvement services and training.
In this respect Six Sigma has captured corporate imagination. Six Sigma is an immensely popular vehicle for initiating and supporting the process of organizational change. Six Sigma has become an industry in its own right. See the names of some of the major US organizations that have adopted Six Sigma in recent times.
Six Sigma is a very flexible concept: to an statistical engineer Six Sigma might be a production quality metric; to a customer service employee, or a CEO, Six Sigma can represent a corporate culture.
The expression Six Sigma was first used in the context of quality improvement by American Motorola engineers in the mid 1980's. Initially within Motorola Six Sigma was purely a quality metric that was used to reduce defects in the production of electronic components.
Six Sigma was then simply a statistical term that specifically referred to a performance target of 3.4 defects per million operations or 'opportunities' (DPMO).
The target of 3.4 defects per million operations which was set by Motorola engineers was to an extent arbitrary and subjective. Even the calculations which arrive at 3.4 defects per million and which correlate to precisely six sigma, are open to debate and different interpretation. At this level, Six Sigma is a highly complex science, so it is not surprising that the meaning of Six Sigma had to change in order for it to become something that managers and employees could relate to.
Sigma is Greek for the letter 'S', and the term 'sigma' has been used for many years by statisticians, mathematicians and engineers, as a measurement unit of statistical variation.
During the mid to late 1980's Motorola developed its Six Sigma ideas, which extended to and embraced many existing quality improvement methods and tools.
Motorola quickly realised that they could extend Six Sigma principles beyond manufacturing - to reduce variation and defects in all aspects of organizational performance.
Following Motorola's success in defining and applying the Six Sigma methodology, Six Sigma became a transferable model. The early adopters of Six Sigma aside from Motorola were Allied Signal (a large avionics company which merged with Honeywell in 1999), and then more significantly the massive GE (General Electric) corporation; (according to most commentators the Six Sigma model was transferred between the Chief Executives of the respective organizations).
GE particularly trumpeted its successes and multi-billion dollars of bottom-line improvements derived from Six Sigma, and by the end of the millennium Six Sigma was established as a mainstream management methodology, and had been adopted by very many of the world's largest corporations.
Strictly speaking the Six Sigma brand is trade-marked in the USA and belongs to Motorola Inc..
Motorola has since developed its own accredited, certified services and training for Six Sigma, within what is called the 'Motorola University'.
Many other organizations and consultancies of all sizes also develop and deliver Six Sigma training, and this activity seems not to be subject to particular mandatory control or accreditation (although Motorola certainly do have established structures and competencies). Seemingly anyone can start up as a Six Sigma consultant, just like anyone can start up as a quality management consultant, or a performance management consultant.
Six Sigma grew quickly from a statistical process for reducing defects in production, to become a 'branded' and yet generic management methodology, whose elements extend far beyond the meaning of the original Six Sigma expression. So, Six Sigma is very flexible, and it continues to evolve, and it's difficult to describe.
What Six Sigma Can Do For Your Company!
Perhaps the most objective way of looking at Six Sigma is to recognise that the Six Sigma methodology essentially provides a framework, and importantly a strongly branded corporate initiative, for an organization to:
- ○ train its people to focus on key performance areas
- ○ understand where the organization wants to go (its strategy, related to its market-place)
- ○ understand the services that the organization's customers need most
- ○ understand and better organize main business processes that deliver these customer requirements
- ○ measure (in considerable detail) and improve the effectiveness of these processes.
Motorola, and as a rule other advocates of Six Sigma, say that as a management system, Six Sigma is a top-down method (ie., instigated at CEO-level) for executing business strategy by using and optimising these process elements:
- ○ Aligning critical improvement efforts to business strategy.
- ○ Mobilizing teams to attack high-impact projects.
- ○ Accelerating the improvement of business results.
- ○ Governing efforts (of teams and people) to achieve and sustain improvements.
Central also to Six Sigma purpose and method is increasing the clarity of business strategy and the metrics that most reflect success within it. Other more recognizable terms for these might be KRA's (Key Results Areas) and KPI's (Key Performance Indicators).
While Six Sigma's attention to process quality variation is arguably greater than most other performance improvement methodologies, the basic principles of establishing and measuring critical processes are not earth-shatteringly new. What is new is arguably Six Sigma's focus (some would say obsessive focus) on detailed analysis.
In this respect Six Sigma's emphasis on detail will logically appeal to organizations with a 'detail culture' and, organizations that have a high proportion of managers who enjoy focusing on accuracy, for example corporations in industries such as engineering, technology, manufacturing, finance, etc.
(I'd be interested to know of any great successes of applying Six Sigma in fields where the organizational culture, service and managerial profiles lean more towards people, communications, relationships, creativity, etc., for example advertising and design, news and media, leisure and entertainment, sport and the arts, research and development, and teaching, training and coaching.
Theoretically, Six Sigma is unlikely to prove hugely successful in environments where people are not good at or inclined to a lot of detailed measurement, processing and checking, but I'm open to evidence to the contrary...)
Six Sigma, while involving and relying on teams is a top-down methodology. This implies quite strongly centralised operating structures and behaviours. Many organizations thrive and depend on such dynamics, but some don't.
Words like 'mobilize' and 'accelerate' and 'high-impact projects' imply that people need mobilizing, that improvement needs accelerating, and that people are not already engaged on high-impact projects. If your organization already has lots of highly mobilised people, is successfully achieving fast-moving improvements, and people engaged on high-impact projects, then probably Six Sigma is not for you.
Training for Nursing Practice
We can work together to develop your DNP proposal and defense sections
Director of Nursing Practice
For DNP students:
You need to start writing your DNP proposal or you need to analyze your data and prepare for your defense; you know this, but you have been hesitating or feel uncertain....
How do I begin? What do I do now that my data is collected? How do I put this all together and prepare for my defense? No matter where you are in your DNP project, I can help you move toward the ultimate goal: your DNP degree.
I can help you develop your PICOT:
To formulate questions in Evidence Based Practice, use the PICOT format.
- Population/Patient Problem: Who is your patient? (Disease or Health status, age, race, sex)
- Intervention: What do you plan to do for the patient? (Specific tests, therapies, medications)
- Comparison: What is the alternative to your plan? (e.g., No treatment, different type of treatment, etc.)
- Outcome: What outcome do you seek? (Less symptoms, no symptoms, full health, etc.)
- Time: What is the time frame? (This element is not always included.)
Your PICOT question will fall under one of these types:
- Therapy/Prevention
- Diagnosis
- Etiology
- Prognosis
We can work together to develop your DNP proposal and defense sections.
Statistical Programs
Need Help with Understanding stats programs with use of data, results, output, databases, and more?
SPSS - Statistical Package for Social Sciences
- Programming (e.g., computation, recodes, conditional execution and looping)
- Statistical analysis (e.g., descriptive statistics, tables, regression, t-test, ANOVA, factor analysis, logistic regression and time series)
- Graphics (e.g., histogram, pie chart, scatter plot, line graph, and 3-D plots)
- Utilities (e.g., sorting, merging and table lookup, transposition and displaying the dictionary for an SPSS system file)
- Spreadsheet appearance: Using interactive graphical SPSS, data are displayed in a matrix similar to a spreadsheet. Data may be entered directly in this window or read from a file.
STATA
Analysis in STATA is centered around four windows: the command window, the review window, the result window, and the variable window. Analysis commands are entered into the command window and the review window records those commands. The variables window lists the variables that are available in the current data set along with the variable labels, and the results window is where the results appear.
I can teach you how to do the following in these programs
- ANOVA (Analysis of Variance)
- Factorial ANOVA
- Repeated Measures ANOVA
- ANCOVA (Analysis of Covariance)
- Factorial ANCOVA
- Repeated Measures ANCOVA
- Binary Logistic Regression
- Bivariate Correlation
- Chi-Square Goodness-of-Fit
- Chi-Square Test of Independence
- Dependent Samples t-test
- Discriminate Analysis
- Exploratory Factor Analysis
- Hierarchical Multiple Regression
- Independent Samples t-test
- Linear Regression
- MANOVA (Multivariate Analysis of Variance)
- Factorial MANOVA
- Repeated Measures MANOVA
- MANCOVA (Multivariate Analysis of Covariance)
- Factorial MANCOVA
- Repeated Measures MANCOVA
- Mediation Analysis
- Multinomial Logistic Regression
- Multiple Regression
- Multivariate Regression
- Phi Correlation
- Point-Biserial Correlation
- Reliability Analysis
- Spearman Correlation
- Stepdown Regression
- Stepwise Regression
- Test for Moderation
Student Reviews
"Bryan was terrific Very upfront and thorough – great reporting – I will recommend to my cohort – Incredible job and quick I will say that it was very inexpensive – I think you could charge more – I got a bunch of other quotes – One was cheaper but did not seem legit – One was close to $2,000." - Katie Boone
"Bryan's mastery of statistics was apparent through the ease with which he grasped and understood the statistical challenges I was grappling with. He not only worked with me through every step of my problem, but he also availed himself almost instantaneously to answer my questions the entire time we were working together. As a result of professionalism, advice and assistance with conceptualizing my design approach, I feel very confident in the quality of the work produced." - Emma, Old Dominion University
"After switching from another statistician to Bryan Hamilton, I am incredibly impressed with Bryan's feedback and recommendations. Bryan was quick to respond to my email and returned my revisions very quickly, considering it was Thanksgiving week. I appreciate that Bryan actually responds with a friendly tone and provides a response with more than one sentence. When others reply with one-sentence responses, this implies that they are too busy to communicate, even when they are being paid for their services. Bryan's responses are also very professional. I am excited to continue to work with Bryan Hamilton." - Graduate student, Grand Canyon University
"I have already recommended Bryan to my classmates. He did a great job and was very knowledgeable, patient and accessible." - Adi Nkwonta
"Bryan has gone above and beyond to help with my dissertation edits. He was always available when I had questions and would reply immediately, including nights and weekends. There is absolutely no way that I could have ever made it to this point without his assistance. Bryan was very understanding and would help break things down and explain how to improve my writing. His statistical knowledge is outstanding and his ability to effectively communicate is amazing. I have been very pleased with his services and plan to use him again in the near future. I would highly recommend Bryan if you are stuck and need some help moving forward on your dissertation. Thanks, Stephen"
"I have been working with Bryan since 2013. In that time, Bryan's statistical knowledge and skill at teaching has allowed me to pass all my exams and tests as part of my PhD. Simply put, without Bryan's help, I would not have been able to progress with my PhD, simple as that. Being a mature student, and not having looked at statistics for several decades, having Bryan's patient and effective coaching gave me the confidence to tackle what would have been an impossible subject to pass. And not only did I pass, but I attained a GPA of 4.0 with straight A's in all of my courses."
"Don't bother looking at the competition. Period. There's no one who comes close. You won't regret making the decision to work with Bryan - for me, it was one of the best academic decisions I've ever made."
"Bryan Is very easy to work with he takes the time required to help you fully understand the problem at hand. He is very knowledgeable and is extremely good at working through a problem in such a way that you are the one actually solving the problem with a few pointers from Bryan to keep you going in the right direction. I would recommend Bryan to any student needing additional assistance."
"I was very lost in my class and did not totally understand what the instructor was requiring for my research paper.
"I found Bryan and my anxiety in the class dramatically decreased."
"Bryan is patient and explains the process in a manner that I can understand. I love all the tools that he utilizes and it helps me to connect the pieces."
"I was ready to quit my Masters program but with Bryan's guidance I now feel confident enough that I can continue in the program. I have already registered for my next research class which begins next month and have informed Bryan that I will once again need his expertise."
"If you are looking for a tutor that has flexible hours, patient, knowledgeable and worth his fees. Bryan is your guy."
"Bryan is very supportive, and patience. He is always available when you need his expertise in the areas of statistics and your thesis and or dissertation research. I highly recommend him."
"Working with Bryan was a fantastic experience. His background really helped to connect with where I was coming from. From helping to make sure I understood basic to more complex statistical concepts, to offering feedback through my dissertation process - it was a joy to work with him. He's very capable, flexible and easy to communicate with!"
“Bryan has gone above and beyond to help with my dissertation edits. He was always available when I had questions and would reply immediately, including nights and weekends. There is absolutely no way that I could have ever made it to this point without his assistance. Bryan was very understanding and would help break things down and explain how to improve my writing. His statistical knowledge is outstanding and his ability to effectively communicate is amazing. I have been very pleased with his services and plan to use him again in the near future. I would highly recommend Bryan if you are stuck and need some help moving forward on your dissertation. Thanks, Stephen”
Tags: Chi Square, dissertation statistical analysis, Dissertation-Statistics-Services, Elementary Statistics, experimental design, experimental statistics, exploratory factor analysis, Factorial ANCOVA, Factorial ANOVA, Factorial MANCOVA, Factorial MANOVA, MANCOVA, manova, meditation-analysis, Point-Biserial Correlation, Probability, Psychology Statistics, psychology-statistics-services, quantitative-analysis, quantitative-research, Quantum Methods, Repeated Measures ANOVA, Repeated Measures MANCOVA, Repeated Measures MANOVA, six sigma, six-sigma-certification, six-sigma-methodology, six-sigma-training, Spearman Correlation, STATA, statistical interpretation, statistical-analysis, statistical-inference, statistical-programming, statistics tutoring, statistics tutors, structural-equation-modeling
Statistics | Inferential Statistics | Psychology Statistics